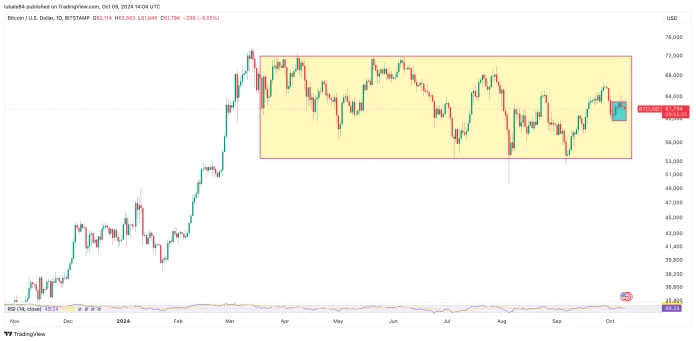
Bitcoin has been stuck between the $72,000 and $54,000 resistance levels after falling from its all-time high of $73,835 on March 14. The direction of Bitcoin’s price is currently unclear as the impact of the US Federal Reserve’s accommodative monetary policy and China’s economic stimulus measures are fading.
Table of Contents
Here’s why Bitcoin is stuck
Bitcoin is stuck between the 50-day and 200-day SMA On September 30, Bitcoin fell below the key support level of the 200-day SMA at $63,525, due to geopolitical tensions in the Middle East.
There have been several attempts to reclaim this level, but none have resulted in a more sustainable price trend.
Btcusd Daily Chart
“On the daily timeframe, we now see confirmation that the 200-day SMA is acting as resistance,” crypto analyst Alan Santana noted in a post on October 8.
“BTCUSD attempted to break above the 200 MA but was unsuccessful. The session ended with a long upper shadow and closed at the lows, creating a strong negative candle.”
Santana was referring to Bitcoin’s price action on October 7, when the price broke above $64,000 but encountered strong selling pressure at the level, causing the price to correct lower. This “confirmed that the 200-day SMA” is resistance, while the 50-day SMA is providing support.
Bitcoin Analytics
Bitcoin Could Continue Moving Sideways in the Coming Weeks
Additional data from market analytics firm IntoTheBlock helps explain the current stalemate between buyers and sellers. The “In/Out of the Money Around Price” (IOMAP) model shows that the price is currently stuck between two key levels.
The 200-day SMA at $63,525 sits in the $61,843 to $63,655 supply zone, where around 1.3 million BTC was purchased by 2.4 million addresses. On the downside, the 50-day SMA at $60,777 sits in the $59,958 to $61,700 support zone, providing strong support for bulls. Around 1.8 million addresses bought around 866,330 BTC in this zone.
Bitcoin Iomap Chart
Data from CoinGlass shows that there are large buy and sell orders building on both sides of the current price. There are currently about $236.36 million sell orders between the spot price and $63,000. Meanwhile, about $313 million buy orders are between the spot price and $61,000.
Note that these prices are very close to the spot price, which indicates a strong tug-of-war between sellers and buyers.
Bitcoin Price Volatility Remains Low Bitcoin price volatility has also remained low since the sell-off on August 5.
Data from TradingView shows that Bitcoin’s historical volatility index is 5.48 as of October 9, well below its yearly high of 14.74 on August 5 and its 2021 high of 42.7.
Bitcoin’s low volatility suggests that BTC’s price is less likely to make large moves in the short term. This suggests that Bitcoin may continue to fluctuate within its current range for the next few weeks.
AZC.News


